All test results are automatically saved after each test execution.
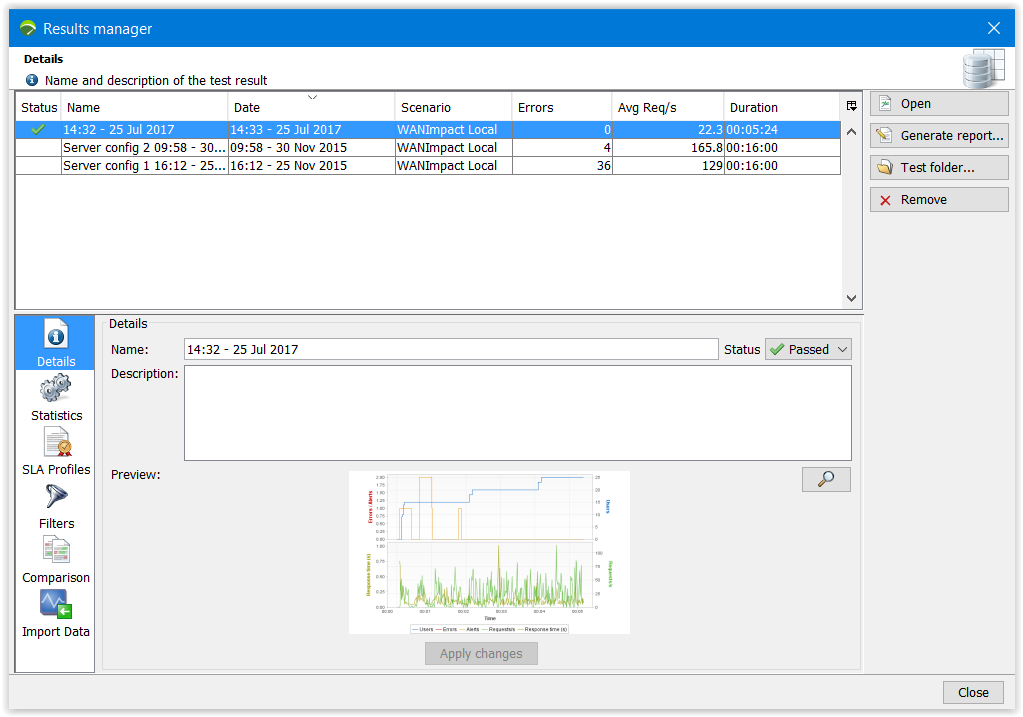
The Results manager screen displays and allows managing the results of a test completed in the current project. It can be accessed with the Tools > Results Manager command.
Columns displayed by default are:
Columns hidden by default and available with the ![]() button are:
button are:
In the Results Manager dialog, clicking Open displays the results of the selected test in the Results section of NeoLoad.
Clicking on the Test folder button opens the directory containing the test results.
To launch the Generate Report wizard, it is necessary to select the appropriate test result then click Generate report. This wizard allows generating either a simple report or a results comparison report.
Clicking on Remove permanently deletes a set of test results.
Deleting superfluous test results is recommended to free up disk space.
The lower part of the Results Manager dialog includes a number of categories which help configure results:
A click on the Details category displays the Details group box.
In Name and Description, the label and descriptive text of the selected test result can be modified.
The Status of a test can also be modified: a test that has been deemed "Passed" can be changed to "Failed" and vice versa.
In the Time group box, the time scale of the x-axis for the graphs can be modified:
Truncated Mean: This area allows obtaining a subset of results with the extremes removed. This excludes non-representative values and provides values close to those obtained by the majority of end users.
Percentiles: This area allows you to define three percentile values to be shown in the Test Summary, Values and Graphs panels.
Possible values for these fields are between 0.1 and 99.9 with a 0.1 granularity.
Time: In this group box, the default time scale of the x-axis for the runtime and results graphs can be specified:
Click the SLA icon to manage the Service Level Agreements linked to the selected test results.
For more information, see Service Level Agreement (SLA) profiles.
A click on the Filters category allows applying a filter to the selected test results according to different criteria.
A click on the Compare category allows comparing two sets of test results in the Results view.
Despite NeoLoad extensive list of monitoring modules, there may be some network constraints which makes monitoring servers difficult (unavailable module in NeoLoad, firewalls, security policies, isolated environments, remote databases, or others).
The NeoLoad Monitoring Data Import function makes it possible to:
NeoLoad 9.0 can import external monitoring data files from tools like Windows 2000 Performance Monitor, or any other solution generating CSV monitoring file. NeoLoad makes it possible to set side by side as many monitoring reports as necessary.
Before starting the import, the generated monitoring file must be copied on the machine hosting the NeoLoad Controller.
The Import Data function is accessible:
In the Results Manager screen, the Import Data category is dedicated to importing a monitoring data file.
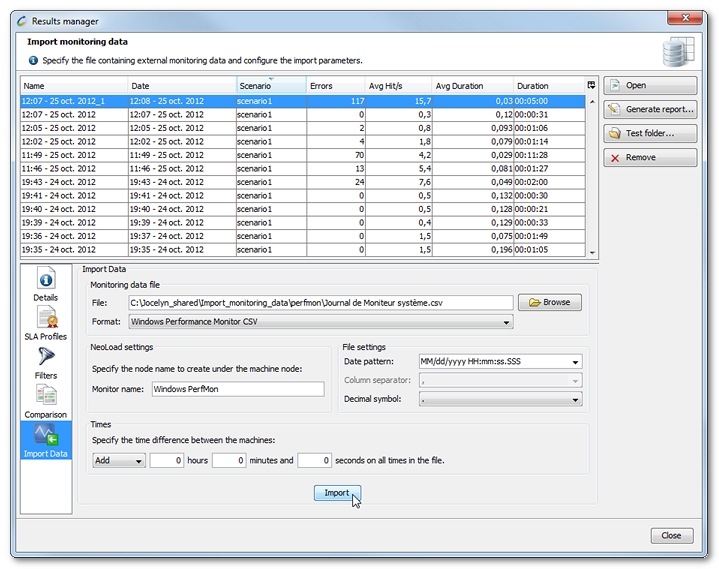
The Monitoring data file group box allows selecting the file to import and declaring its format:
"<any>"<separator>counterName1<separator>counterName2<separator>..."<Timestampvalue1><separator><counterValue1><separator><counterValue2><separator>..."TimeStamp","Memory used (%)","CPU Used (%)""12/17/2012 15:52:55.324","57","7"In the NeoLoad settings group box, the Monitor name field can be completed with a free unique value. The default labels—"Imported monitor" for CSV imports, "Windows PerfMon" for Windows Performance Monitor imports, and "Imported NeoLoad monitor" for NeoLoad imports—are incrementally numbered once imported.
In File settings, the structure of the monitoring file must be defined. When a predefined format is selected in Format, the structure characteristics are set by default and dimmed. When importing a specific monitoring file, the drop-down boxes are all available:
The Times group box is useful when the monitoring file has been recorded in a different time zone or when the server and the controller are not sychronous. The drop-down list makes it possible to Add or Substract as many hours, minutes, and seconds as necessary to synchronize the file and the NeoLoad results. The reference time is the load test time, that is the time on the Controller machine.
date and time commands on Windows).A click on OK starts the import. Once the import is complete, it can be viewed, as documented in View imported monitoring data. NeoLoad automatically detects whether the imported file includes measures from different servers, and displays them distinctively.
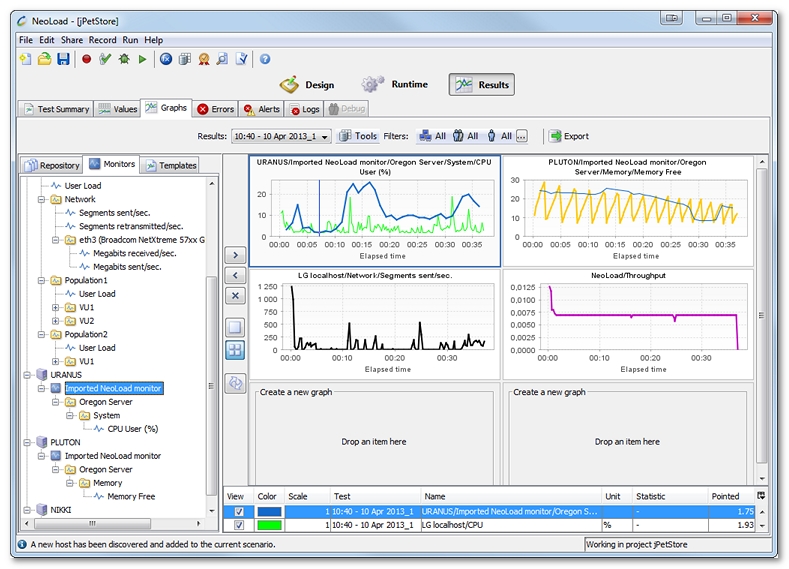
NeoLoad can read external monitoring files and integrate the results into the analysis views of the Results section. The monitors are identified with the name of tested server and the name of the file specified at the import.
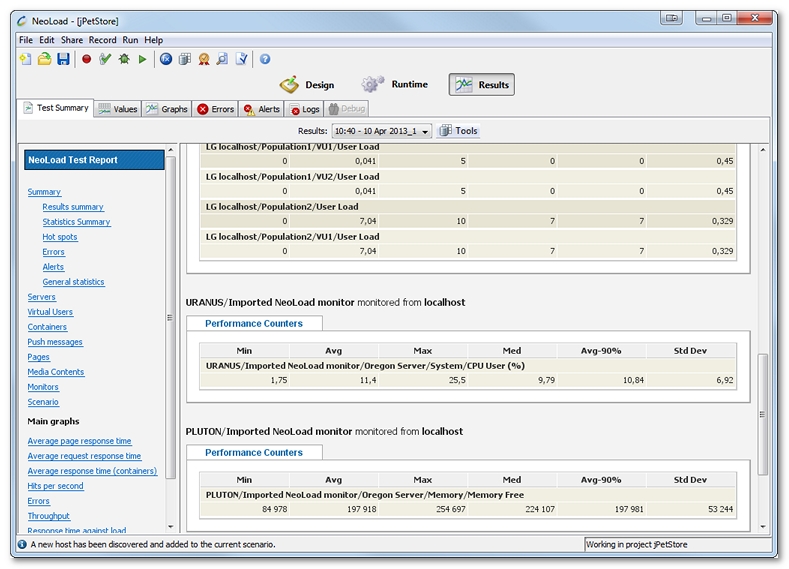
In the Test Summary tab, the Monitors section displays the Performance Counters of the imported monitoring files together with the NeoLoad Performance Counters.
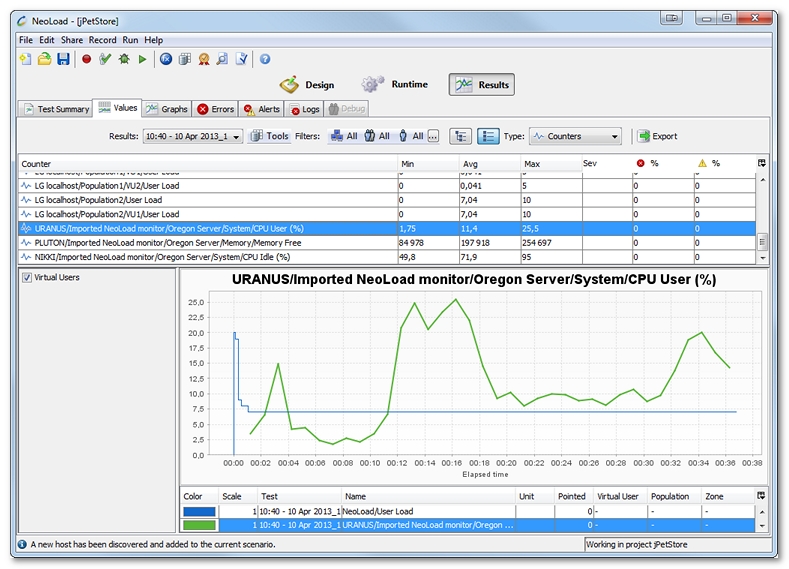
In the Values tab, it is necessary to select Counters in the Type drop-down list to have the Performance Counters of the imported monitoring files together with the NeoLoad Performance Counters.
In the Graphs tab, a click on the Monitors sub-tab gives access to all the measures of the imported monitors together with the NeoLoad monitors.